Highly Customizable, Visual Interface for Improved Insight
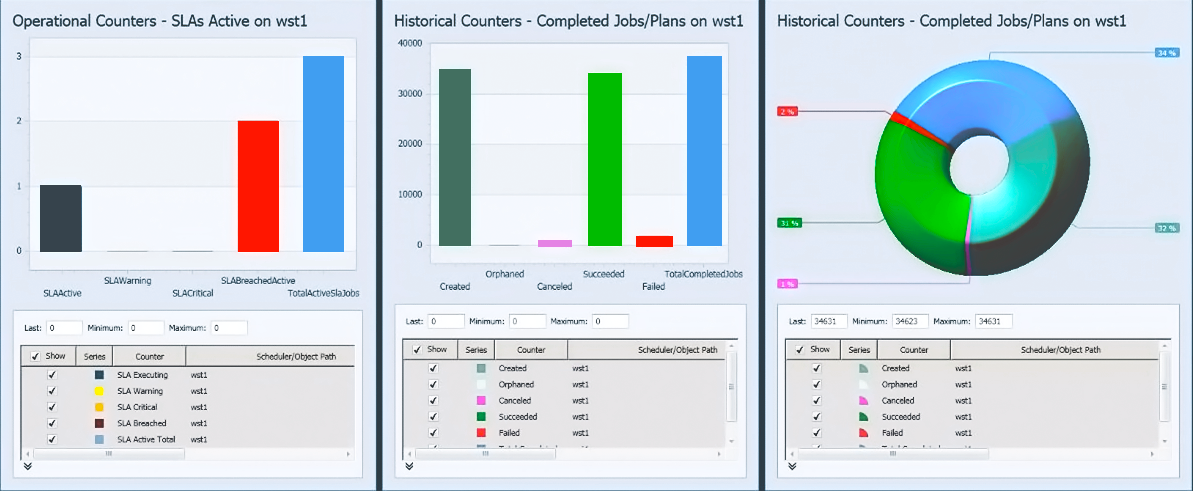
The ActiveBatch Dashboard is a standalone program that provides a simple, visual interface for the entire automation environment. The dashboard provides a visual representation of ActiveBatch performance, job scheduler health, and workload analytics. The dashboard helps users better understand the health and performance of their automation environment.
Monitor Real-Time and Historical Progress
Using the ActiveBatch Dashboard, developers and operations can quickly and efficiently monitor both the real-time and historical progress of their business and IT operational workflows through visual aids that map key performance metrics. ActiveBatch supports the use of multiple views, allowing different users and departments to toggle between different types of information.
Support for a Variety of Graphing Elements and Reporting Tools
The ActiveBatch Dashboard includes four graphing elements: a line graph, bar graph, pie chart, and a special job scheduler health graph element. Operational and historical counters can be set to identify and present data on executing jobs, waiting jobs, total active jobs, success rates, failure rates, SLA jobs, and more. Additionally, the dashboard supports a variety of reporting tools, such as placing alerts on counters, providing users with a notification when a given counter has reached a certain alert level.
